Interface DevConsoleRPCTab
The Developer Console RPC Tab
The "RPC" tab of the Smart GWT Developer Console allows you to trackRPCRequests and DSRequests sent from your application. Tracking is activated by checking the "Track RPCs" box at the top of the tab. The main "RPC History" list shows the transactions that have been sent from your application since the session began (since you checked the "Track RPCs" box or refreshed your browser, whichever happened most recently). Each entry in the list represents either a server roundtrip, a DSRequest to a clientOnly DataSource or a direct request to a webservice. Request queues are shown as separate entries, with the requests that made up the queue shown indented beneath it.
Each entry in the RPC History list shows useful diagnostic information, including:
- Whether the request was sent via a server-side proxy
- The URL of the request, or an indication that the request was client-only
- The type of request -
DSRequest,RPCRequest,WSRequestorQueue - The DataSource name, operation type and operation ID
- The success/failure status of the request, if it has completed
- Basic timing information
Detailed timing/profiling information
Smart GWT and Smart GWT Server can gather detailed profiling information for a request/response roundtrip, and display it in the Developer Console. Note, the server-side information is only available for DSRequests, and only if you are using the Smart GWT Server module. Extra levels of server-side detail are available if you are also using one of Smart GWT Server's built-in DataSource types (note, at the time of writing this only applies to SQLDataSource). Note, detailed timing information is derived using the RPCManager.getTimingData() API: you can programatically derive exactly the same timing metrics by calling that method from your own code
- To enable detailed timings, either:
- Set debug log category "RpcTabTiming" to INFO level in "Logging Preferences" (see
Debuggingfor details) - Click the "Track client-side timings" checkbox in the RPC tab
- Set debug log category "RpcTabTiming" to INFO level in "Logging Preferences" (see
- If you want to collect details of the server-side processing, either:
- Set
DSRequest.returnTimingData: truein yourserver.propertiesfile. This will cause server timing information to be gathered and returned for every DSRequest from every client - Enable the built-in RPCs "areServerTimingsTracked" and "trackServerTimings" via the
RPCManager.enabledBuiltinMethodssetting of yourserver.propertiesfile (these builtin RPCs should already be enabled in a development environment). When these built-in RPCs are enabled, server timing data can be switched on and off on a per-client basis, via a checkbox in the Developer Console.
- Set
- To enable both client-side and server-side timings programatically, call
isc.RPCManager.setTimingEnabled(true)before invoking your DSRequest. Pass false to the same API to switch timing off again. - To globally prevent collecting details of the server-side processing, set
DSRequest.allowReturnTimingData: falsein yourserver.propertiesfile. This will unconditionally prevent server timing information from being gathered; it beats the methods mentioned above for gathering server timings
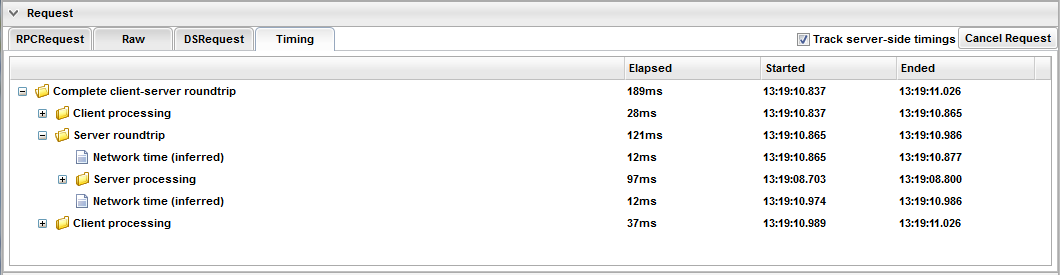
The timing data is tree-structured; a node with an opener next to it can be expanded to drill into more detail:
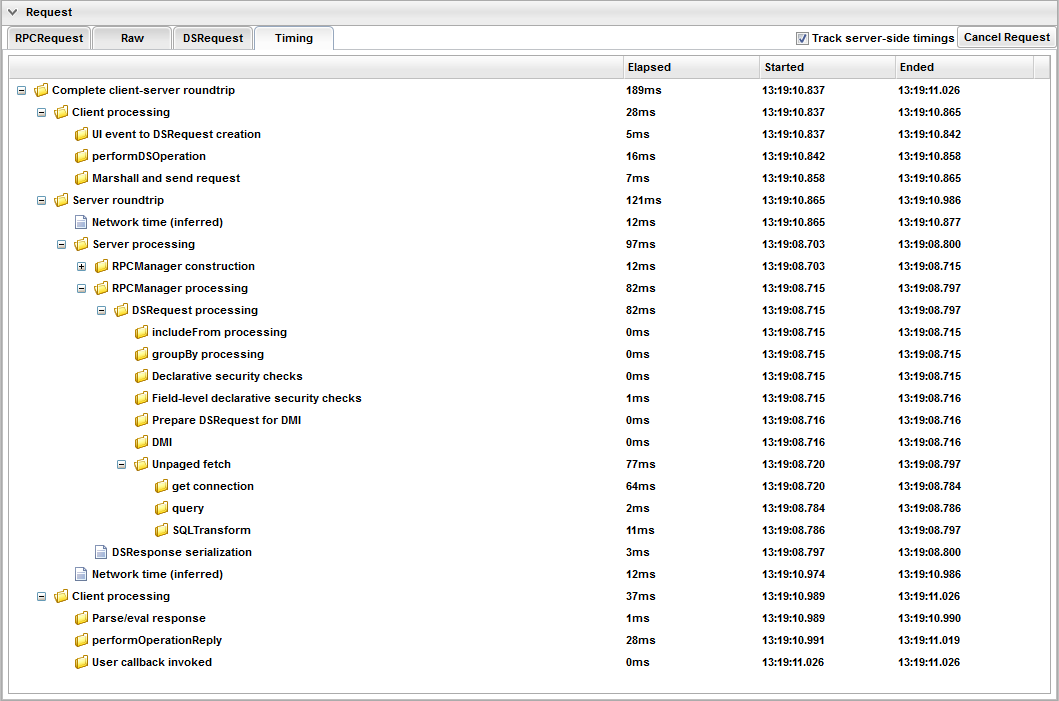
The following important points apply to the detailed timing information:
- It is meaningless to compare the actual start and end timestamps reported by the client with those reported by the server, because their clocks are unlikely to be exactly synchronized (unless the client and the server are actually the same machine). The timestamps are the underlying raw data - it is much more meaningful to consider the elapsed times than the timestamps
- The basic timing details reported in the main RPC History list do not correspond to the detailed timing data because the detailed timing data attempts to cover the entire period of the transaction, from the UI event to calling the user callback method. By contrast, the basic timing data only covers the period from when the request left the client to when the response was received by the client. The basic timing "Time Sent" and "Elapsed time" figures correspond to the "Server roundtrip" entry in the detailed timing data
- The "Network time (inferred)" measurements are informed guesswork. We calculate the difference between the "Server turnaround" time measured by the client and the "Server processing" time measured by the server, and apply half of that difference to either side of the "Server processing" figure as "Network time (inferred)". Note that this guesswork can easily mean that network timings overlap with server processing timings, even when the client and the server are the same machine
- The "UI event to DSRequest creation" timing measures the time from the most recent event to be registered by the EventHandler subsystem, to that of DSRequest creation (and hence, incidentally, is not recorded for RPCRequests). This is often a meaningful thing to measure, but not always. If the DSRequest was created programatically during application startup or off the back of a timer, then the most recent UI event clearly had no influence and so measuring the time since it happened has no meaning. However, most DSRequests are created, directly or indirectly, as a result of a UI event; so even though we can't tell which DSRequests belong to events and which don't, we still provide the figure in the timing data as something that will be "often useful"